
How to Integrate Plant Data So Management Actually Uses It (Without Empty, Good-Looking Dashboards)
Most industrial plants already generate enormous amounts of data.
Process variables.
Production.
Consumption.
Alarms.
Downtime.
Quality.
Maintenance.
However, when a plant manager asks:
Which production line experienced the most downtime this week?
Where are we losing productivity?
What was the main cause of production downtime?
Which process should receive the next investment?
The answer often still arrives hours later.
Or even worse.
It arrives in a manually compiled Excel spreadsheet.
This raises an inevitable question.
What is the value of having so much plant data if it is still difficult to use?
The answer is not to create more reports.
It is to integrate information so that it genuinely supports decision-making.
The Problem Is Not a Lack of Information
For years, the industrial sector has invested in automation technologies to collect data.
Today, most industrial plants have:
PLCs.
SCADA systems.
Smart instrumentation.
Sensors.
Databases.
Production management systems.
The challenge has changed.
It is no longer about obtaining information.
It is about turning that information into actionable insights.
As Diego Francisco Cárdenas Lozano, Operations Manager at Ingelam, explains:
“We don’t want our customers to see more data. We want them to make better decisions with it.”
This shift in perspective completely transforms how an organization approaches industrial digitalization.
The Most Common Mistake: Building Reports Just to Display Information
When an organization begins a digital transformation project, an immediate need often arises:
“We need a KPI dashboard.”
And the dashboard gets built.
Charts.
Colors.
Indicators.
Trends.
But a few months later, something common happens.
The dashboard still exists.
Management has stopped using it.
Why?
Because displaying information is not the same as answering business questions.
A good system should not simply show how much a production line manufactured.
It should help explain why that line achieved those results.
Data Integration Is Much More Than Connecting Systems
Integrating industrial data is not simply about connecting a PLC to a database.
It means building an architecture where all information has context.
For example:
Production.
Quality.
Maintenance.
Energy consumption.
Downtime.
Alarms.
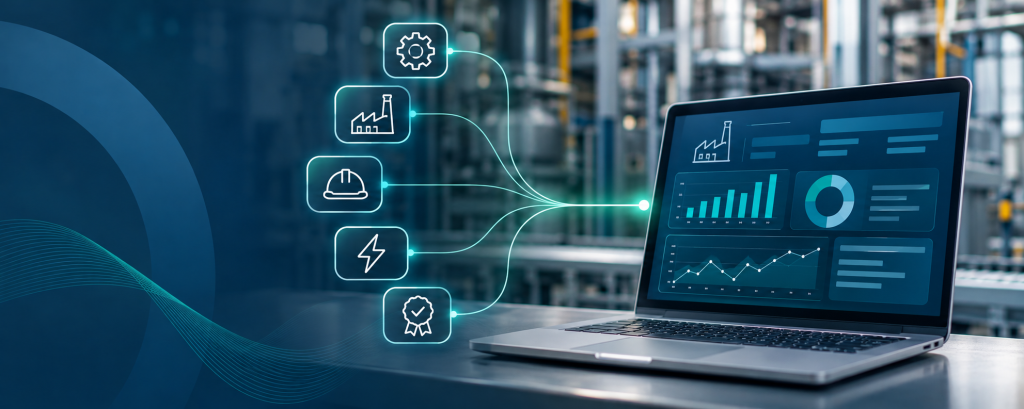
When these variables can be connected and analyzed together, answers that were previously difficult to obtain begin to emerge.
And that is where the true value of industrial analytics begins.
What Information Does Management Really Need?
Not everyone needs to see the same process variables.
While an operator needs to know the real-time status of a process, a plant manager typically needs answers to different questions.
For example:
What was the overall equipment effectiveness (OEE) this week?
Which production line shows the greatest variability?
Where are production losses concentrated?
Which shift delivers the best results?
Which process requires priority attention?
Designing a system around these decisions completely changes the usefulness of the information.
Five Principles for Building Useful Industrial Data
1. Integrate Before Visualizing
Manufacturing KPIs are only reliable when they come from properly integrated data.
2. Prioritize Decisions, Not Charts
Every indicator should answer a specific operational question.
If a data point does not support a decision, it probably does not need to be on the dashboard.
3. Automate Data Collection
Critical information should come directly from the plant floor, reducing dependence on manual data entry.
4. Put Data into Context
An isolated downtime event reveals very little.
Connecting it with production, quality, and maintenance data helps reveal its real operational impact.
5. Display Only What Matters
More information does not necessarily mean better management.
Clarity always creates more value than quantity.
From Plant Data to Action
One of the main objectives of industrial analytics is to reduce the time between what happens on the plant floor and the decisions an organization needs to make.
When information is properly integrated, it becomes possible to:
Identify trends.
Prioritize investments.
Discover opportunities for improvement.
Take action before greater losses occur.
Information then stops being merely a historical production report.
It becomes a management tool.
Ingelam’s Vision
At Ingelam, we understand that industrial digital transformation is not about filling screens with KPIs and charts.
It is about building an architecture where the right information reaches the right person at the right time.
That is why our projects integrate industrial automation, OT networks, production management, and industrial analytics so that the data generated by operations truly drives better decisions.
Because a good dashboard is not the one with the most charts.
It is the one that helps answer the questions that truly matter to the business.
SADI: Information Designed for Decision-Making
With this philosophy, we developed SADI (Industrial Analytics System).
Its purpose is not to generate more reports.
It is to transform plant-floor data into reliable performance indicators that support production management, maintenance, quality, and executive decision-making.
When data stops being isolated and begins working together, operations gain visibility and management gains confidence in its decisions.
Does Your Plant Data Help You Make Decisions or Just Generate Reports?
If your organization already generates production data, but decisions still depend on spreadsheets, manual data consolidation, or reports that arrive too late, the next step may not be to introduce more technology.
It may be to better integrate the technology you already have.
👉 Let’s discuss how an industrial data integration and analytics strategy can help you turn plant data into decisions that drive productivity.
